
Warehouse KPI’s That Actually Matter: 15 Metrics Every 3PL Should Track
Warehouse KPI’s That Actually Matter: 15 Metrics Every 3PL Should Track
Warehouse dashboards can display hundreds of numbers. That does not mean every number deserves management attention.
The most useful warehouse KPI’s do more than describe activity. They reveal whether inventory is accurate, orders are moving on time, labor is being used effectively, client commitments are being met and warehouse activity is producing a reasonable return. A strong KPI should also point toward an action. If a metric changes but nobody knows what to investigate or improve, it is probably just a report
not a meaningful performance indicator.
This distinction is especially important for third-party logistics providers. A 3PL may operate several warehouses, serve clients with completely different order profiles and perform everything from pallet receiving to individual-unit picking, kitting and returns. A single warehouse-wide average can hide the client, shift, process or order type actually causing the problem.
This guide explains 15 warehouse performance metrics that 3PL operations should track, how to calculate them and what each one can tell you about the warehouse.
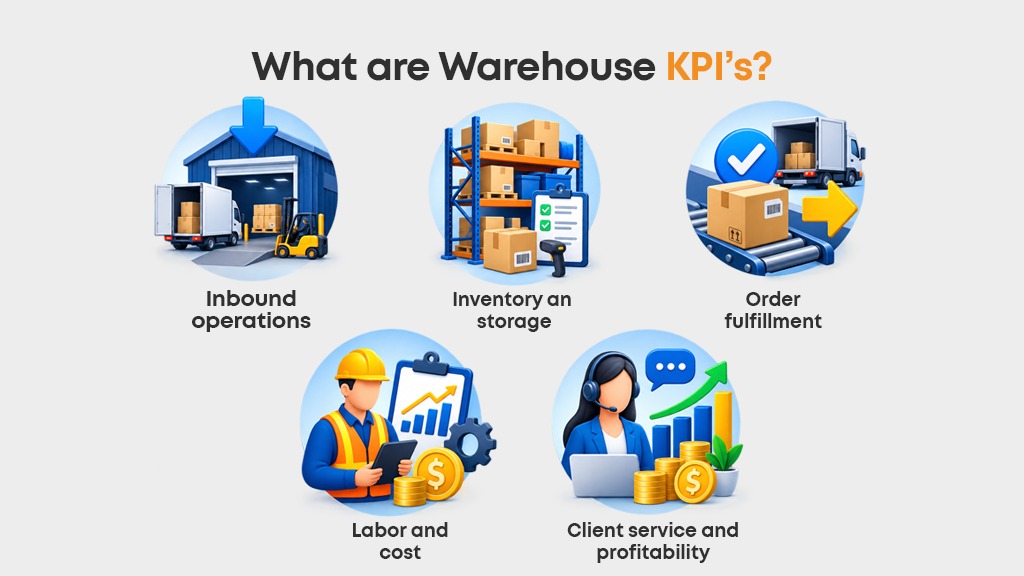
What are Warehouse KPI’s?
Warehouse key performance indicators are measurable values used to evaluate how accurately, quickly, safely and cost-effectively a warehouse performs. They translate everyday warehouse transactions into information managers can use to identify bottlenecks, compare performance and make better operational decisions.
A complete view of warehouse performance normally covers five areas:
- Inbound operations
- Inventory and storage
- Order fulfillment
- Labor and cost
- Client service and profitability
Tracking only one area can create misleading results. For example, increasing picking speed may look positive until picking accuracy falls. Raising space utilization may appear efficient until aisles and staging areas become congested. Reducing labor hours may lower costs while causing orders to miss carrier cut-offs.
The objective is not to maximize every number independently. It is to understand how speed, accuracy, service and cost affect one another.
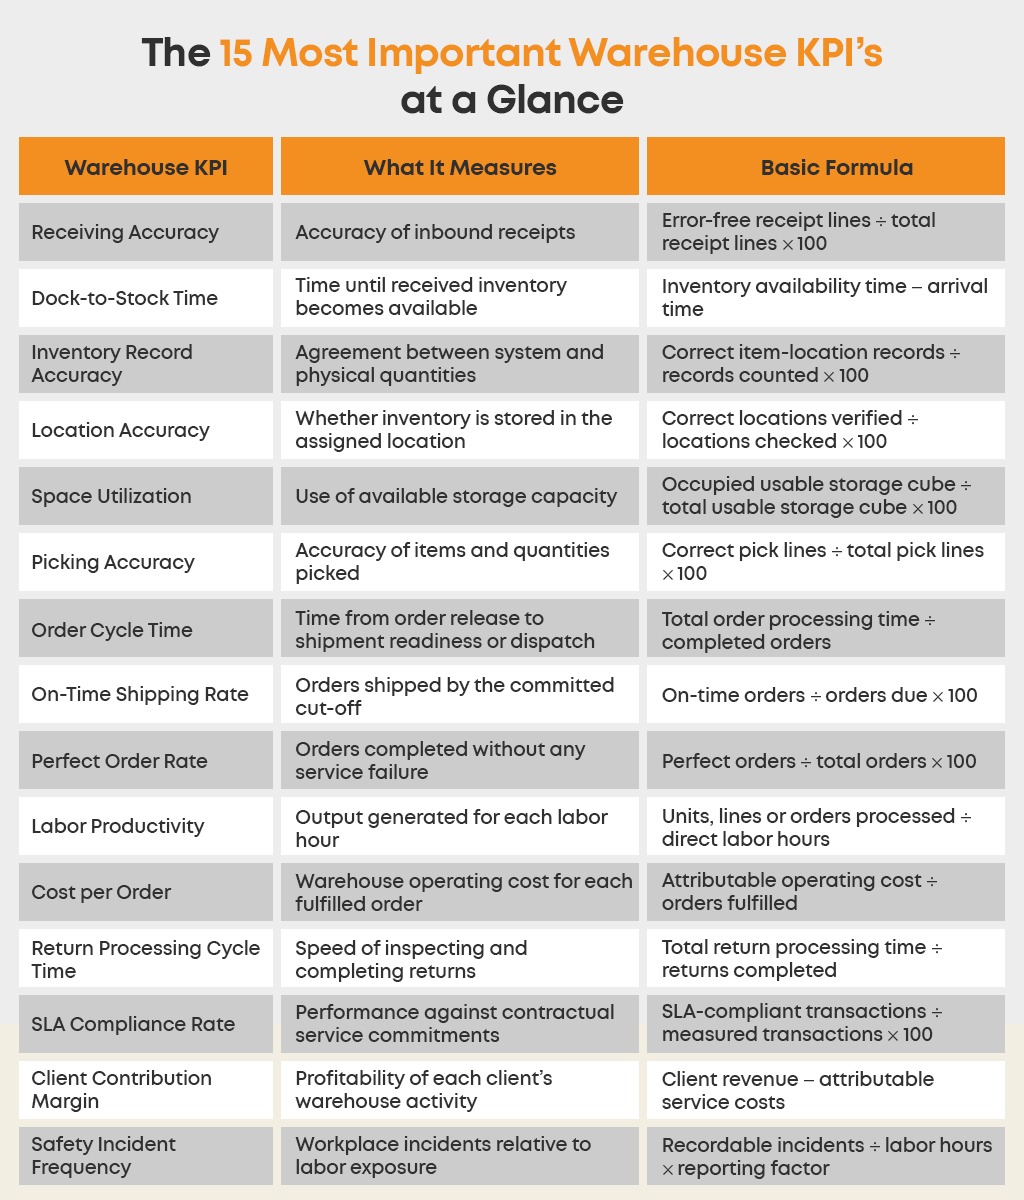
These formulas provide a useful starting point, but every 3PL should document the precise start time, end time, inclusion rules and data source for each metric. Without a shared definition, two managers can calculate the same KPI differently and reach conflicting conclusions.
1. Receiving Accuracy
Receiving accuracy measures whether inbound inventory is recorded correctly when it enters the warehouse. It should validate more than the total number of units received. Depending on the client and product, an error-free receipt may need the correct SKU, quantity, condition, unit of measure, lot number, serial number and expiration date.
Formula:
Receiving Accuracy = (Error Free Receipt Lines ÷ Total Receipt Lines Received) × 100
Measure receipt lines rather than complete shipments when you need to identify where errors occur. A shipment containing 50 lines should not be treated the same as a shipment containing one SKU simply because both count as one receipt.
Low receiving accuracy can create problems throughout the warehouse. An incorrect quantity becomes an inventory discrepancy. An incorrect lot or serial number weakens traceability. A damaged item recorded as available may later be allocated to an order. Errors that enter at the dock are usually more expensive to correct after putaway.
Segment this KPI by client, supplier, warehouse, receiver and product type. If one supplier consistently sends incorrect quantities or documentation, the solution may involve vendor compliance rather than employee retraining.
A warehouse receiving process connected to purchase orders, scanning, inspection and exception recording gives the warehouse a reliable foundation for every downstream metric.
2. Dock-to-Stock Time
Dock-to-stock time measures how long it takes for newly arrived inventory to become recorded, stored and available for allocation or use. It begins at a defined inbound event such as vehicle arrival, unloading start or receipt creation and ends when the inventory becomes available in its assigned storage location.
Formula:
Average Dock-to-Stock Time = Total Time from Arrival to Inventory Availability ÷ Receipts Completed
The start and end points must remain consistent. One warehouse cannot start the clock when the truck arrives while another starts after unloading and still expect a fair comparison.
A rising dock-to-stock time may indicate congestion, insufficient receiving labor, slow inspections, poor labeling, delayed discrepancy resolution or a weak putaway process. It also affects more than the inbound team. Inventory that is physically inside the building but unavailable in the system cannot be allocated confidently to open orders.
Review the total time, then separate it into unloading, verification, inspection, staging and putaway. This shows where the delay actually occurs. If receiving is completed quickly but pallets remain in staging for hours, adding another receiver will not solve the problem.
For 3PLs, dock-to-stock performance should be compared by receipt type. A standard pallet receipt and a mixed-SKU container requiring inspection should have different targets.
3. Inventory Record Accuracy
Inventory record accuracy shows how closely WMS quantities match the stock physically present in the warehouse. It is one of the most important warehouse management KPI’s because unreliable inventory data disrupts allocation, replenishment, picking, reporting and client confidence.
Formula:
Inventory Record Accuracy = (Item-Location Records with Correct Quantities ÷ Total Item-Location Records Counted) × 100
Using correctly matched item-location records is generally more informative than dividing total physical units by total recorded units. Large positive and negative errors can cancel one another at an aggregate level even though several SKUs are wrong.
Suppose a cycle count checks 500 item-location records and 490 match the system exactly. Inventory record accuracy is:
(490 ÷ 500) × 100 = 98%
The percentage is useful, but the variance details explain the cause. Track discrepancies by SKU, location, transaction type, client and employee. Repeated differences after receiving may point to inbound errors, while variances in active pick faces may indicate unconfirmed picks or replenishments.
Regular cycle counting allows a warehouse to measure and improve accuracy continuously instead of waiting for an annual physical inventory. A warehouse inventory tracking system should also preserve a clear movement history so managers can investigate why a discrepancy occurred.
4. Location Accuracy
Inventory record accuracy answers, “Do we have the quantity shown in the system?” Location accuracy answers, “Is that inventory where the system says it is?” A warehouse can have the correct total quantity and still experience fulfillment delays because products are stored in the wrong bins.
Formula:
Location Accuracy = (Correct Item Locations Verified ÷ Total Item Locations Checked) × 100
Poor location accuracy increases search time, short picks and unnecessary replenishment. It also encourages experienced employees to rely on memory instead of the WMS, which makes the operation more dependent on specific individuals.
Measure location accuracy during cycle counts, bin audits and exception investigations. Review both directions: confirm that the expected inventory exists in the assigned location and that the location does not contain unidentified or incorrectly stored stock.
When this KPI declines, investigate unscanned putaway, temporary staging, unauthorized bin transfers, unclear labels and locations that hold visually similar products. Scan-confirmed movements and well-designed location labels help keep physical activity aligned with system records.
5. Space Utilization
Space utilization measures how much usable storage capacity is occupied. For warehouses storing cartons, cases and pallets at different heights, cubic utilization usually provides a more realistic picture than floor area alone.
Formula:
Space Utilization = (Occupied Usable Storage Cube ÷ Total Usable Storage Cube) × 100
The word “usable” matters. Offices, travel aisles, safety clearances, dock areas and other non-storage space should not be treated as available rack capacity.
Higher utilization is not automatically better. A warehouse operating close to its theoretical maximum may lack room for receiving peaks, replenishment and efficient movement. Congestion can increase travel time, double handling and safety risk. The appropriate target depends on the storage system, product dimensions, order profile and amount of temporary staging required.
Analyze utilization by zone, client and storage type. One client may occupy significant space with slow-moving inventory while another generates higher throughput from a smaller footprint. This information can support slotting decisions, capacity planning and storage-rate discussions.
The goal is not to fill every available position. It is to use space in a way that supports safe and efficient flow.
6. Picking Accuracy
Picking accuracy measures whether employees select the correct SKU, quantity, unit of measure, lot or serial number for an order. Because picking errors directly affect customers, this is one of the most visible 3PL warehouse KPI’s.
Formula:
Picking Accuracy = (Correct Pick Lines ÷ Total Pick Lines) × 100
An alternative is to measure error-free orders, but line-level measurement offers better diagnostic detail. An order containing 40 lines presents more opportunities for error than a single-item order.
Define what counts as a picking error. It may include:
- Wrong SKU
- Incorrect quantity
- Wrong lot, batch or serial number
- Incorrect unit of measure
- Product picked from an unauthorized location
- Short pick when inventory was available
Picking accuracy should be reviewed alongside productivity. If picks per hour rise while accuracy falls, the warehouse may be increasing output at the expense of rework, returns and customer satisfaction.
Modern order picking software can verify products and locations during the task instead of depending on a final check to catch every error. Different methods, including batch picking, zone picking and wave picking, should also be compared within similar order profiles rather than combined into one average.
7. Order Cycle Time
Order cycle time measures how long an order spends inside the fulfillment process. For warehouse reporting, the clock might begin when the order is received, released or made eligible for picking and end when it is packed, ship-ready or dispatched.
Formula:
Average Order Cycle Time = Total Time from Order Release to Defined Completion ÷ Orders Completed
Choose start and end events that the warehouse can control. Delivery time after carrier handoff may matter to the client, but it should not be mixed into internal fulfillment cycle time unless the 3PL also controls transportation.
An overall average can conceal delays, so examine each stage:
- Order received to released
- Released to first pick
- Picking duration
- Waiting time before packing
- Packing to shipment creation
- Shipment creation to carrier handoff
The waiting time between activities often reveals more opportunity than the processing time itself. An order may take only eight minutes to pick but remain in a queue for several hours before work begins.
Segment cycle time by priority, order size, channel, client and service level. Comparing a 100-line wholesale order with a single-unit ecommerce order creates a number that accurately describes neither workflow.
8. On-Time Shipping Rate
On-time shipping rate measures whether orders leave the warehouse by the promised ship date or operational cut-off. It focuses on the portion of the customer promise controlled by the fulfillment operation.
Formula:
On-Time Shipping Rate = (Orders Shipped by the Committed Cut-Off ÷ Total Orders Due) × 100
“Shipped” must have a consistent definition. Printing a label should not count as on-time shipment if the package remains in the warehouse after carrier collection. A more reliable completion event may be manifest confirmation, dock verification or documented carrier handoff.
Late shipment analysis should record a reason code. Common causes include inventory shortages, order holds, picking backlogs, integration failures, missing documentation, carrier capacity and orders received after the agreed cut-off.
For fair client reporting, pause or exclude time when an order cannot progress because the customer has not supplied required information. Otherwise, warehouse performance may appear poor because of delays outside the 3PL’s control.
Track this metric daily and highlight orders at risk before the deadline. A real-time warehouse KPI dashboard should support intervention, not merely report yesterday’s misses.
9. Perfect Order Rate
On-time shipping answers only one part of the service question. Perfect order rate measures how many orders satisfy every agreed fulfillment requirement without an error.
Formula:
Perfect Order Rate = (Orders Shipped Complete, Accurate, On Time, Undamaged and Correctly Documented ÷ Total Orders Shipped) × 100
This is a strict metric: if an order fails one required condition, it is not perfect. Depending on the contract, the definition may include:
- Correct products and quantities
- Complete fulfillment
- Shipment by the promised cut-off
- Correct label, documentation and carrier service
- Damage-free handling
- Accurate tracking information
- Compliance with client-specific packing rules
Perfect order rate is valuable for executive and client reporting because it combines several aspects of service into one outcome. However, it should never replace the component metrics. If the perfect order rate declines, managers still need picking accuracy, fill performance, damage codes and on-time shipping data to determine why.
Report both the overall percentage and the number of failures attributed to each cause. That converts a high-level service KPI into an improvement plan.
10. Labor Productivity
Labor productivity measures the amount of warehouse work completed for each direct labor hour. It can be calculated using orders, lines, units, cartons, pallets or tasks, depending on the process.
Formula:
Labor Productivity = Units of Work Completed ÷ Direct Labor Hours
For example, if a picking team completes 4,800 order lines in 80 direct labor hours, its productivity is:
4,800 ÷ 80 = 60 lines per labor hour
The unit of work must match the activity. Pallets per hour may be suitable for putaway, receipt lines per hour for inbound processing and pick lines per hour for fulfillment. Combining unlike activities into “orders per hour” can reward simple work and make complex assignments appear inefficient.
Compare performance by process, zone, shift, equipment and order profile. Use the metric to investigate slotting, travel, replenishment, training and workflow design not simply to rank employees.
Context is essential. Productivity may decline because a worker received more multi-line orders, handled fragile products or spent time resolving inventory exceptions. A WMS should preserve enough task-level information to explain the result rather than turning productivity into an isolated score.
11. Cost per Order
Cost per order shows how much the warehouse spends to fulfill an order. It connects operational activity with financial performance and helps determine whether efficiency is improving as volume grows.
Formula:
Cost per Order = Total Attributable Warehouse Operating Cost ÷ Orders Fulfilled
Relevant costs may include direct labor, supervision, packaging, equipment, software, facility expenses and allocated overhead. Decide which cost categories are included and keep that definition consistent across reporting periods.
Suppose a facility incurs $180,000 in attributable operating costs and fulfills 60,000 orders during the month:
$180,000 ÷ 60,000 = $3 per order
For a multi-client 3PL, one warehouse-wide number is rarely enough. A wholesale pallet order, a subscription box and a multi-line direct-to-consumer order require different levels of work. Calculate cost by client and order profile using relevant drivers such as lines, units, touches, packaging or special services.
A falling cost per order is positive only if service remains stable. Review it with picking accuracy, perfect order rate and on-time shipping to ensure savings are not creating downstream failures.
12. Return Processing Cycle Time
Return processing cycle time measures how long it takes to inspect a returned item, record its condition, complete the required disposition and update inventory or client records.
Formula:
Average Return Processing Cycle Time = Total Time from Return Receipt to Final Disposition ÷ Returns Completed
The end point may be restocking, quarantine, repair, disposal or return-to-vendor, depending on the client’s rules. Use separate targets when some products require technical inspection or authorization.
Slow return processing creates several problems. Resellable inventory remains unavailable, warehouse space fills with unresolved products and customers wait longer for a refund or replacement. Returns can also become difficult to bill when the work performed is not recorded as part of the workflow.
Track the reasons items are returned as a companion measure. Distinguish warehouse-caused returns such as wrong items, packing errors, damage or incorrect labels from product preference, carrier damage and client-authorized returns. That separation prevents the 3PL from being held responsible for causes outside its control.
A structured reverse logistics workflow helps the warehouse record receipt, condition, disposition and inventory impact consistently.
13. SLA Compliance Rate
Service-level agreement compliance measures how consistently the 3PL meets the commitments defined for a client. Those commitments may cover receiving turnaround, same-day shipping, inventory accuracy, order accuracy, returns processing or reporting.
Formula:
SLA Compliance Rate = (Transactions Meeting the Defined SLA ÷ Total Transactions Measured) × 100
Every SLA should specify:
- The event that starts the clock
- The completion event
- Business hours and cut-off times
- Exceptions and exclusions
- Data source
- Reporting frequency
- Responsibility for missing information or inventory
Without these details, clients and providers may interpret the same commitment differently.
Do not combine every service commitment into one percentage only. Provide a high-level SLA score when useful, but retain individual results for receiving, accuracy, fulfillment and returns. This allows both parties to see where performance is strong and where corrective action is required.
For a 3PL, client-specific SLA reporting is more meaningful than a warehouse-wide average. One demanding account can be missing its agreed cut-off while the facility’s overall on-time rate still appears healthy.
14. Client Contribution Margin
Revenue alone does not reveal whether a client relationship is profitable. A high-volume account may generate substantial revenue while requiring manual reporting, frequent exception handling, specialized packaging and more labor than the pricing agreement covers.
Client contribution margin connects warehouse activity with the economics of the account.
Formula:
Client Contribution Margin = Client Revenue − Direct and Attributable Service Costs
It can also be expressed as a percentage:
Contribution Margin Percentage = (Client Revenue − Attributable Costs) ÷ Client Revenue × 100
Include the operational costs associated with receiving, storage, picking, packing, supplies, returns, kitting, account management and client-specific requirements. The calculation does not need to allocate every corporate expense perfectly to be useful. It needs to be consistent enough to identify accounts whose workload and pricing are misaligned.
Accurate billing is essential. If completed warehouse activities are not captured, a client can appear unprofitable because revenue is missing rather than because the service agreement is inadequate. An integrated 3PL billing system can connect receiving, shipping, storage and value-added services with client-specific rates.
Review contribution margin with service quality. The objective is not simply to reduce service for less profitable accounts. It is to identify process improvements, pricing adjustments and activities that should be included in the agreement.
15. Safety Incident Frequency
No warehouse performance dashboard is complete without a safety measure. Higher throughput is not an improvement if it is achieved by creating unsafe travel, excessive congestion or rushed material handling.
A common approach measures recordable incidents relative to labor hours:
Safety Incident Frequency = (Recordable Incidents ÷ Total Labor Hours) × Standard Reporting Factor
The reporting factor and definition of a recordable incident vary by country and regulatory framework, so the safety team should use the applicable local standard. The same method must be used consistently when comparing periods or facilities.
Lagging indicators such as incidents should be reviewed with leading indicators, including near-miss reports, safety observations, equipment inspections and corrective-action closure. A facility with no reported incidents is not necessarily low-risk if employees are not reporting hazards.
Warehouse data can help identify operational conditions associated with risk, such as congested zones, excessive travel, rushed peaks, repeated equipment exceptions or storage beyond designated capacity. Safety remains a management responsibility, but accurate operational data supports better prevention.
Why 3PLs Should Not Use One Benchmark for Every Client
Benchmark articles often provide a single target for inventory accuracy, picks per hour or dock-to-stock time. Those numbers can offer context, but they should not become universal standards without considering the work involved.
A 3PL may handle:
- Single-unit ecommerce orders
- Multi-line wholesale orders
- Full-pallet distribution
- Temperature- or lot-controlled products
- Serialized electronics
- Kitting and assembly
- Client-specific packaging
- Products requiring inspection or compliance documents
Each operation has a different labor requirement, error risk and reasonable cycle time. Comparing them through one average can lead to poor decisions.
Segment warehouse performance metrics by:
- Client
- Warehouse
- Shift
- Order channel
- Order size
- SKU velocity
- Product handling requirement
- Carrier service
- Workflow or picking method
The formula should remain consistent, but the target may differ. This gives management a fair comparison while preserving visibility across the operation.
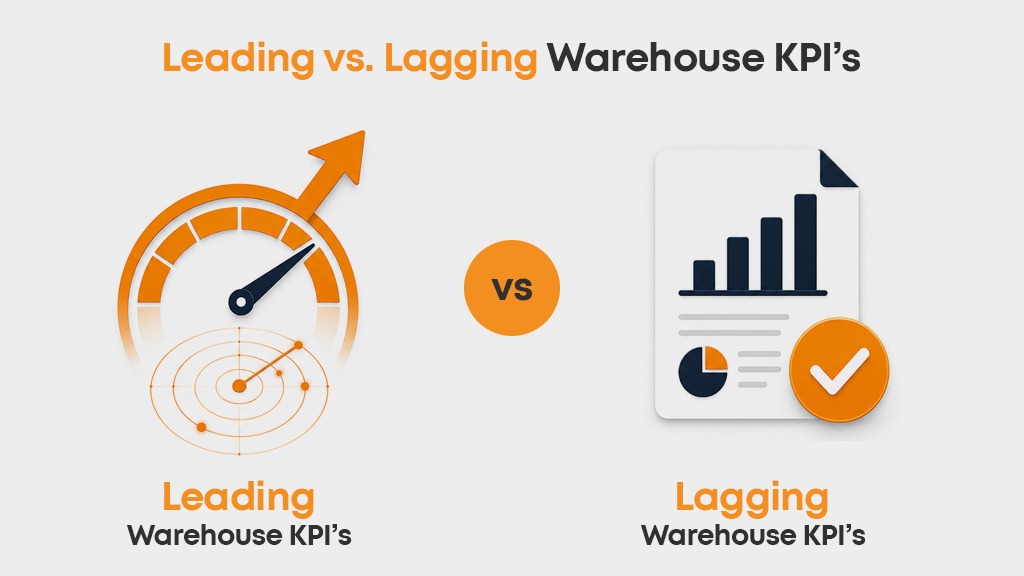
Leading vs. Lagging Warehouse KPI’s
Lagging KPI’s confirm an outcome after it has happened. Picking accuracy, perfect order rate, cost per order and SLA compliance are examples. They are essential for performance reporting, but they may identify a failure only after an order is complete.
Leading indicators provide earlier warning. They include open orders approaching cut-off, receiving backlog, unresolved inventory exceptions, replenishment tasks waiting and returns sitting without disposition.
A useful warehouse KPI dashboard should display both. Managers need historical trends for accountability, but they also need current exceptions that can still be corrected.
For example, yesterday’s on-time shipping rate explains performance. Today’s orders at risk of missing cut-off help protect performance.
How Often Should Warehouse KPI’s Be Reviewed?
Not every metric needs to be reviewed at the same frequency.
Daily Operational Review
Daily reporting should focus on conditions that require immediate action: receiving backlog, dock-to-stock delays, open orders, picks per hour, picking accuracy, orders at risk and on-time shipping.
Weekly Performance Review
Weekly analysis should examine inventory accuracy, location accuracy, return processing, productivity by process, space constraints and recurring exception reasons. This is where supervisors can identify patterns rather than responding to isolated events.
Monthly Business Review
Monthly reporting should connect operational performance with clients and cost. Review SLA compliance, cost per order, client contribution margin, capacity trends and billing completeness. Compare current results with prior periods and agreed improvement targets.
The reporting schedule should match the speed at which the warehouse can respond. A metric reviewed monthly is not useful for preventing a shipment from missing today’s cut-off.
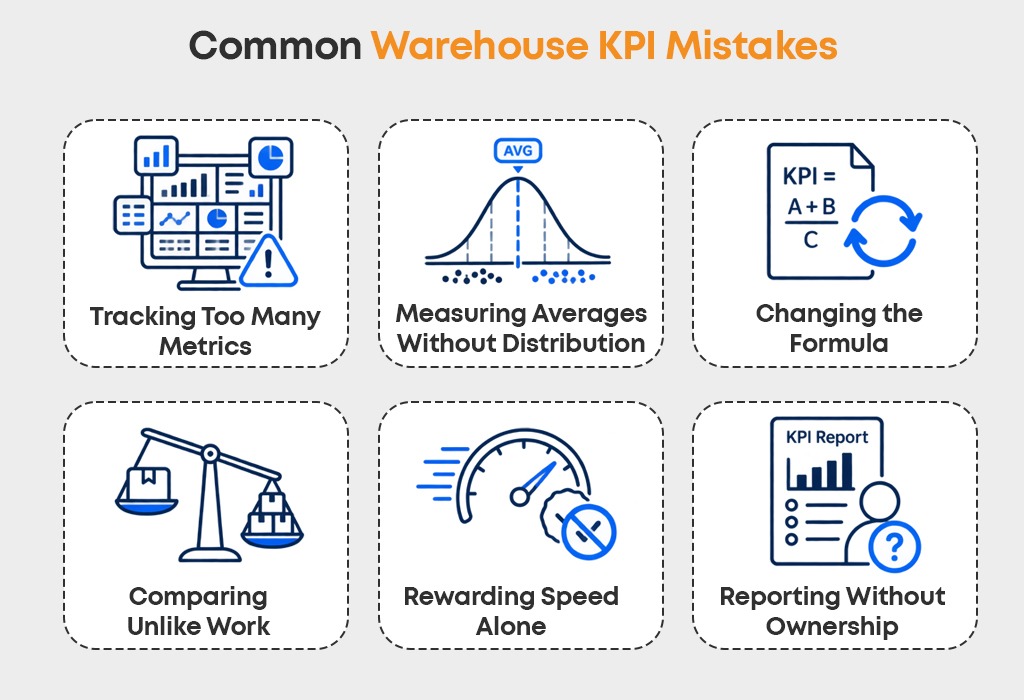
Common Warehouse KPI Mistakes
Even accurate calculations can produce poor decisions when the measurement design is weak.
Tracking Too Many Metrics
A dashboard filled with dozens of equally prominent charts makes priorities unclear. Select a small number of primary KPI’s for each role and allow users to investigate the supporting data when a result changes.
Measuring Averages Without Distribution
An average order cycle time can look acceptable while a small group of orders experiences severe delays. Review percentiles, aging ranges and exception counts alongside the average.
Changing the Formula
If the start point, end point or exclusions change, the trend is no longer comparable. Document each KPI definition and apply it consistently across reporting periods.
Comparing Unlike Work
Do not compare piece picking with pallet movement or simple orders with customized fulfillment. Segment the data before evaluating performance.
Rewarding Speed Alone
Productivity targets can create errors when employees believe speed matters more than accuracy or safety. Pair throughput metrics with quality and safety measures.
Reporting Without Ownership
Every KPI should have an owner, review frequency and agreed response. A red indicator is not useful if nobody is responsible for investigating it.
How a WMS Improves Warehouse KPI Tracking
Manual KPI reporting often depends on spreadsheets assembled after the work is complete. This delays visibility and creates questions about which file or calculation is correct.
A modern warehouse management system records the events behind the metrics as employees complete receiving, putaway, picking, packing, shipping, counting and returns. That creates a consistent operational record and makes it possible to analyze performance by client, warehouse, user, SKU, order or process.
The system should not stop at displaying charts. Managers should be able to move from a KPI to the transactions behind it. If dock-to-stock time rises, they need to see the affected receipts. If order cycle time increases, they need to identify where orders waited. If client contribution falls, they need visibility into activity, cost and billable services.
AI-assisted reporting can make this information easier to access. A manager may ask which warehouse had the latest shipments, which SKUs generated the most activity or how revenue changed by client without manually assembling multiple reports. The value lies in reducing the time required to move from a question to an operational answer.
Turn Warehouse Data into Operational Decisions
The purpose of tracking warehouse KPI’s is not to make a dashboard look complete. It is to help the warehouse detect problems earlier, improve client service and understand the real cost of the work being performed.
Start with a controlled set of metrics across inbound, inventory, fulfillment, labor, client performance and safety. Define every formula clearly. Segment the data so different clients and workflows are evaluated fairly. Most importantly, connect every KPI to an owner and an action.
3PLNext is a cloud-based warehouse and fulfillment management system that brings inventory, receiving, picking, shipping, returns, multi-client operations, reporting and 3PL billing into one platform. Its AI Assistant also helps users access operational insights by asking questions in natural language rather than searching through multiple reports.
If your warehouse data is spread across reports and spreadsheets, request a 3PLNext demo to see how connected WMS data can provide clearer visibility into warehouse performance.
Frequently Asked Questions
What are the most important warehouse KPI’s for a 3PL?
The most important 3PL warehouse KPI’s include inventory accuracy, dock-to-stock time, picking accuracy, order cycle time, on-time shipping, perfect order rate, labor productivity, cost per order, SLA compliance and client contribution margin. The exact priorities depend on the operation and client agreements.
How many warehouse KPI’s should a 3PL track?
A 3PL can store and analyze many metrics, but each role should focus on a limited set of primary KPI’s. Frontline managers need daily operational measures, while leadership needs broader service, cost, capacity and profitability indicators. More metrics do not automatically produce better decisions.
What is the difference between a warehouse KPI and a warehouse metric?
A warehouse metric measures an activity or result. A KPI is a metric selected because it directly reflects an important operational or business objective. Every KPI is a metric, but not every available metric is important enough to become a KPI.
How do you measure warehouse productivity?
Warehouse productivity is calculated by dividing completed units of work such as receipts, pallets, pick lines or orders by the direct labor hours required. Productivity should be measured separately by task and order type so unlike work is not compared unfairly.
Should every 3PL client have the same KPI targets?
No. A 3PL should use consistent formulas but establish targets that reflect each client’s order profile, product requirements and service agreement. Client-level reporting prevents strong performance in one account from hiding problems in another.
How does a WMS track warehouse KPI’s?
A WMS records timestamps, inventory movements, task completions, order status, user activity and exceptions throughout warehouse workflows. These transactions can be used to calculate KPI’s automatically and provide real-time dashboards, detailed reports and client-specific performance views.





Leave a Reply