Top 5 Warehouse KPIs You’re Probably Overlooking and How to Track Them
In the dynamic world of warehousing, what gets measured gets managed. While metrics like order accuracy (99%+ is the gold standard) and on-time delivery rates dominate boardroom discussions, many hidden KPIs silently shape your bottom line. In fact, 42% of warehouses admit they lack visibility into critical operational metrics (MHI Annual Industry Report). This oversight can lead to inflated costs, unhappy customers, and missed growth opportunities.
Let’s dive into five underrated warehouse KPIs that could be costing you thousands—and how to turn them into actionable insights
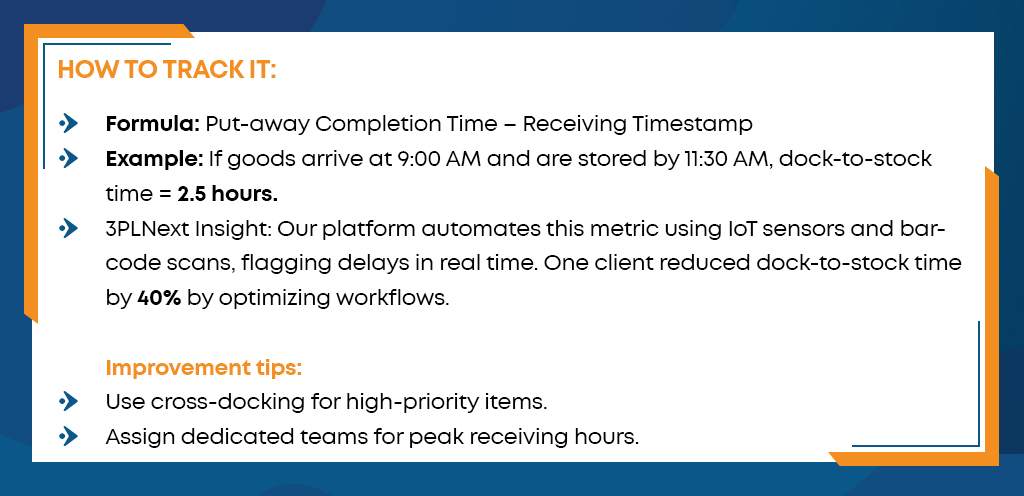
1. Dock-to-Stock Time
What it is: The time taken from receiving goods at the dock to storing them in their designated locations.
Why it’s overlooked: Most warehouses prioritize outbound speed, assuming inbound processes “take care of themselves.”
Why it matters: Delayed put-away locks up inventory, increases labor costs, and creates bottlenecks. For example, a 2-hour delay in storing perishable goods could lead to spoilage or missed same-day shipping deadlines.
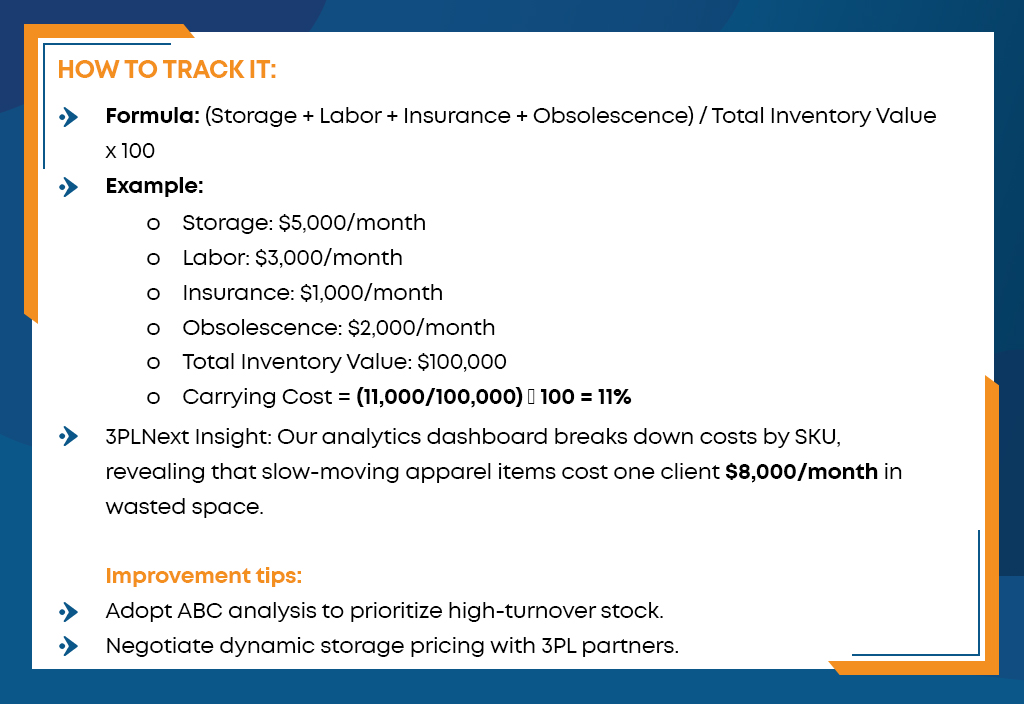
2. Inventory Carrying Cost
What it is: The total cost of holding inventory, including storage, labor, insurance, depreciation, and obsolescence.
Why it’s overlooked: These costs are often buried in financial statements and not analyzed at the SKU level.
Why it matters: Carrying costs can devour 18-35% of a product’s value annually. For instance, storing 100,000 worth of electronics with a 25% holding expense, making 25,000/year in hidden expenses**.
3. Employee Turnover Rate
What it is: The percentage of warehouse staff leaving over a specific period.
Why it’s overlooked: Often dismissed as an “HR problem,” turnover directly impacts productivity and training budgets.
Why it matters: The average turnover rate in warehousing is 36%, and replacing a single employee cost 5,000−10,000 in recruitment and training. A warehouse with 100 employees losing 36/year spends 180,000−360,000 annually on turnover.

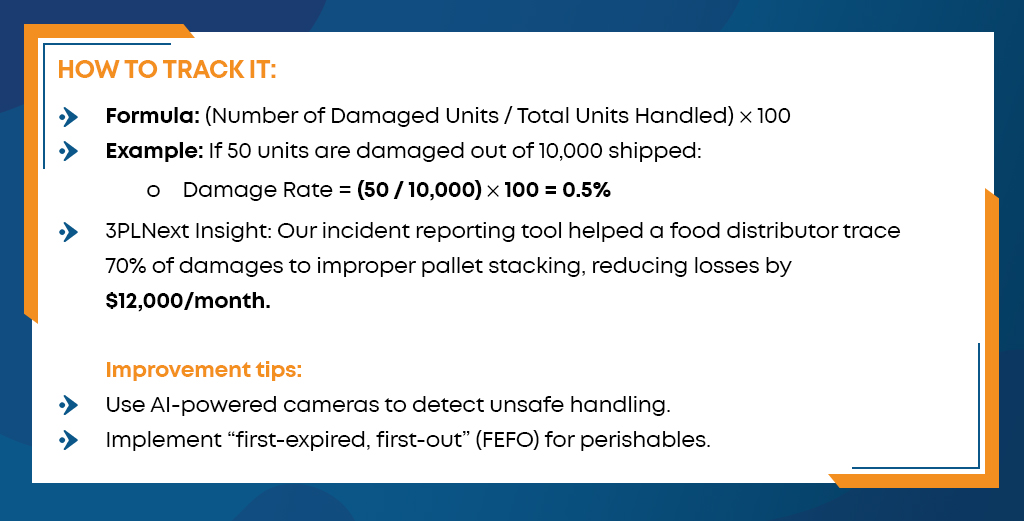
4. Damaged Inventory Rate
What it is: The percentage of goods damaged during handling, storage, or shipping.
Why it’s overlooked: Damages are often absorbed as “operational costs” rather than investigated.
Why it matters: A 2% damage rate on 1Minventorymeans∗∗1Minventorymeans∗∗20,000 in losses annually**—plus customer trust erosion. For example, a retailer with 500 damaged orders/month could face 6000+ negative reviews/year.
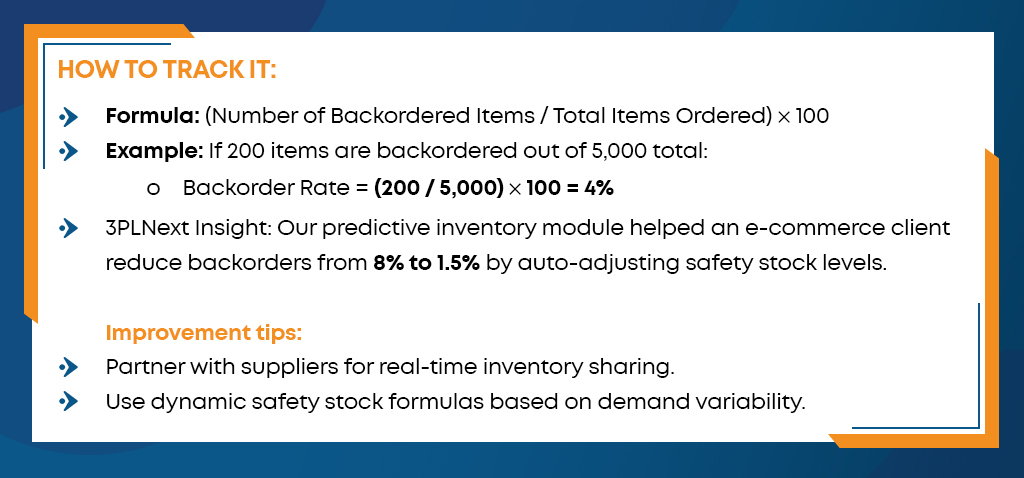
5. Backorder Rate
What it is: The percentage of customer orders delayed due to stockouts.
Why it’s overlooked: Many warehouses rely on rush orders or substitutions to mask shortages.
Why it matters: A 5% backorder rate for a company processing 10,000 orders/month means 500 unhappy customers. If 20% of those customers defect, that’s 50,000 in lost revenue (assuming 50,000 in lost revenue (assuming 500 LTV per customer).
Conclusion
Overlooking these five KPIs—Dock-to-Stock Time, Inventory Carrying Cost, Employee Turnover, Damaged Inventory, and Backorder Rate—is like ignoring a leaking faucet: the losses add up silently. For example, a warehouse with 10M annual revenue could recover 10M annual revenue could recover 500,000+ yearly by optimizing these metrics.
With 3PLNext’s warehouse management system, you can:
- Automate KPI tracking with AI-driven dashboards.
- Slash carrying costs by 15-30% through smarter inventory planning.
- Turn real-time data into profit-boosting decisions.
Ready to plug the leaks? Book a Demo and see how 3PLNext transforms overlooked KPIs into competitive advantages.


Leave a Reply